Our Products

Server-side monitoring [ AI. ]

Through automated real-time monitoring, the internal call topology of the back-end application is visualized and combined with its performance diagnosis, business analysis and other functions, it can quickly conduct business troubleshooting, and improve the time to locate the root cause of the problem to the second level.

Apply the visualization of the global topology, Quickly grasp the overall operating status of the application
Code-level application server performance monitoring, rapid business troubleshooting, Root cause location of second-level problems
Sort out the business execution logic through the Web transaction portal, Automatically restore business calling relationships
Ai can automatically discover web transaction entry and visualization of topology, which can help users to automatically associate many individual services in the application according to business execution logic, so as to accurately evaluate the quality of business services.
A single user requests call chain tracking, Fast realization of fault domain isolation for business performance bottlenecks
The call chain tracking records the call details of a single user's slow request across the entire application link, including the code execution status of each node in the call path, database performance, etc. Through the automatic restoration of a single user request to call the link, you can quickly locate the faulty node that affects business performance, and you can drill down to find the code-level cause in depth.
Intelligent code depth tracking, Quickly and accurately locate the root cause of the problem
When the application has performance problems, Ai can be combined with the dynamic baseline function to obtain the complete request operation status at the first time, including code execution, database calls, third-party interfaces, etc., to locate the problem more accurately and efficiently.
User service monitoring is combined with host container monitoring, Omnidirectional assisted positioning problem
The host container data collection frequency is as low as once a minute. It monitors more than ten indicators such as CPU, memory, disk, network, Load Average, TCP connection, file open count, and real-time linkage of web transactions with indicators, which can quickly locate application faults The root cause, real-time understanding of the running status of the host container.
Custom transactions implement user operations and back-end services Logical aggregation and splitting to accurately monitor user business
Through the custom transaction function, Ai aggregates requests with the same characteristics (for example, with the same parameter name and the same URI) to form relevant monitoring data and call links. At the same time, Ai can also split a composite request (different back-end services through different parameters) to achieve more accurate monitoring of user transactions.

Product advantages

Self-learning dynamic baseline to realize intelligent monitoring and early warning

Ai's dynamic baseline function is to perform self-learning by automatically calculating the performance data within 15 days (daily baseline) or the last 8 weeks (weekly baseline), dynamically adjusting the alarm threshold and the frequency of snapshot data collection, which can not only reduce invalid alarms , It can also predict performance bottlenecks and feed back problems before users report failures.

NETWORK MONITORING [ NI. ]

The Network Insight solution uses network packet mirroring and layer 2 to 7 protocol analysis technology to provide a 7 x 24 hour all-round view of key applications without affecting the operation of the customer's application system, allowing application management, operation and maintenance personnel to perceive the system at any time Health and customer experience, discover problems in time, and quickly locate problems.

Service path organization function that fits the application architecture, Help quickly sort out and display business logic
Ni allows customers to define different services based on the listening port, protocol, server IP address group and client IP address group.
User experience and user behavior tracking, Fully grasp the quality of application delivery
Perceive user experience before user complaints, find users affected by performance or errors, track a series of visits of a single user, deeply analyze the specific reasons for slow access, and locate whether the network transmission is slow or the application server responds slowly
Business transaction analysis and full transaction tracking capabilities, Realize all-round monitoring of business transactions
Accurately match customer business and differentiate user behavior by business; automatically connect the end-to-end transaction chain to flexibly extract key information; save all transaction data and analyze transaction statistics in multiple dimensions.

Product advantages

Powerful packet processing capabilities and comprehensive network performance indicators help quickly locate network faults

Using high-performance acquisition technology, it supports a single-machine traffic processing speed of up to 2Gbps. Can combine mirror data, sflow, SNMP data to comprehensively analyze problems.

End-to-end fault domain location to realize the rapid determination of fault causes

Through in-depth analysis of the protocol response delay, it is possible to distinguish network delay, host delay or application delay, through the combination with Grand Festival Infrastructure Insight. Quickly judge when there is a problem, and locate the bottleneck problem that causes poor application access.

BROWSER-SIDE MONITORING [ BI. ]

Bi capture includes every detail of page loading on the user side: server time, network latency, web page loading timing, page rendering time, JavaScript script errors, AJAX call details, user characteristics and other performance and operation related information; at the same time; Provide positioning analysis and comparative analysis based on time distribution, and provide granular reports such as daily and weekly reports.

User experience monitoring, Fully grasp the quality of web application delivery
From the perspective of quickly locating the problem, Bi defines five indicators: "Server queuing time-consuming", "Web application time-consuming", "Network time-consuming", "Web page loading time-consuming", "Resource loading time-consuming" five indicators, and based on 15 types Different indicators and different user characteristics are considered to find out the experience defects that need to be optimized.
Slow page detail monitoring to accurately locate the root cause of the fault
Bi captures every detail of slow user requests, including: user access time, user access IP, browser type and version number, single request server response time, etc. Based on HTTP protocol, W3C standard time-consuming swim lane chart and page loading element waterfall chart, it provides fine-grained fault location capability.
Multi-dimensional data analysis and comparison, easy to find the key points of optimization
Bi provides user characteristic information such as browser, geographic location, device type, IP address, etc. User characteristics are compared and analyzed with specific indicators, and the proportion of different user characteristics can be viewed. Through comparative analysis, the business operation and maintenance department can optimize targeted Web applications.
AJAX request monitoring, insight into the asynchronous performance behind the page
Bi can collect the occurrence time, execution time, traffic, number of calls, requested throughput, http status of AJAX, and help users gain insight into the performance of asynchronous interactions after the page.
Collect JavaScript errors and quickly restore the scene of page faults
Collecting JavaScript script errors, you can quickly understand and count the JS errors reported by the client. JS error statistics are broken down into URL, time of occurrence, browser type, error information, request parameters, custom parameters, sample stack information, etc.
By customizing user events, the event path can be fully traced to analyze and quantify related user behaviors and businesses
Bi provides comprehensive website operation analysis services, supporting page trajectory optimization, page interaction optimization, business funnel analysis, business path correlation optimization, user behavior analysis and other capabilities, thereby further providing technical support for the efficient operation of web sites.

Product advantages

Customize key business to help users quickly focus on the quality of core business

Users can define one or a group of URLs as a key business according to business management needs. The group management of Web pages can be realized through key services, which is convenient for users to centrally manage the quality of the core pages of their core services.

Single user behavior tracking, accurately restore user page operation behavior

Session-based single-user behavior tracking, complete records of each user's access trajectory, accurately locate the problem page that affects the user experience, and the cause of the problem page.

MOBILE MONITORING [ MI. ]

Mi displays core performance indicators such as mobile application interaction performance, crash rate, HTTP error rate, network error rate, behavioral data such as user access trajectories, user actions, and operational data such as active users, allowing users to have a more comprehensive and in-depth understanding of the current application The overall performance experience status, promote product optimization and upgrade.

User experience score, comprehensive and intuitive evaluation of APP quality
The user experience is evaluated from the three core indicators of user action, network request, and crash, and the user distribution is summarized in multiple dimensions such as application version, operating system, device, and region.
Backtrack user visits, restore user operations 100%
Complete record of each user's access trajectory, by viewing a single user's access, backtracking of slow movements, wrong requests and crashes during the process.
User action analysis, comprehensive insight into performance vulnerabilities
Comprehensively monitor the page interaction and network request information caused by each click of a user action, find APP performance bottlenecks in time, and locate user experience optimization points.
Combined analysis of performance and operational data, Easily discover APP quality improvement points
According to indicators such as total requests, slow requests, and error requests, a multi-dimensional combined analysis of the distribution is performed on different application versions, regions, network types, system versions, and devices. Through the statistics of the proportion of network requests in multiple indicator dimensions, in-depth analysis of the details of network request errors, and intuitive discovery of hidden performance hazards
Network request monitoring
According to different domain names, the response time of each network request, the first packet time, socket tcp link establishment time, DNS time, transmission volume, frequency and error rate are displayed. Through dimensional analysis, the distribution of slow requests in any or multiple dimensions can be displayed, so that performance problems can be accurately located, and the details of slow requests can be drilled down to further locate the problem in combination with Grand Festival end-to-end analysis.

Product advantages

Crash analysis, in-depth location of the root cause of the failure

Detailed display of the device, operating system, application version, number of occurrences, and users affected by a certain type of crash, restore the track of the crash, and locate the crash code line.

WebView monitoring

WebView page loading real-time tracking, display the corresponding page URL white screen time, CPU, memory consumption, JS error and other performance indicators, analyze page loading time and resource loading time, targeted optimization of WebView performance experience.

Software Design & Development [ UI. ]

Our Capabilities
RESEARCH & DESIGN

Digital Business Consulting

Data Analytics & Statistics

User Experience Design (UX)

User Interface Design (UI)

Responsive Web Design (RWD)

Advanced Data Visualization

Visual Design

SOFTWARE ENGINEERING

Information Architecture Design

Web & Mobile Development

Enterprise Systems

System Integrations

Cyber Security

Robotic Process Automation (RPA)

Data Warehouse

Web-based Applications
Cloud Interactive Web Applications offer advantages in usability and scalability that make them well suited for many corporate and enterprise scenarios.
Mobile Applications
Cloud Interactive not only designs and develops revolutionary mobile applications, but also helps you build business strategies that maximize the potential of mobile computing for your firm.
Web Design & Development
Our User-Centered Design philosophy ensures that we are always empathetic and attentive to your users’ needs. Our expert back-end team provides flexible solutions that respond instantly, scale rapidly, and are easily managed.
Enterprise Systems & Internal Infrastructure
Cloud Interactive custom Enterprise Solutions help you manage complexity, enhance communication, and provide critical infrastructure for your business activities.

Product advantages

The Benefits of Fixed Price Agile Projects

Higher product quality

Reduced costs

Better client satisfaction

Solution

End-to-end application performance management (Grand Festival) solution

Perform application performance analysis from the client, network, server, and container levels. It can go into applications and databases to automatically capture application performance exceptions, automatically identify problematic application components and codes, and use key business performance analysis for in-depth analysis of failure causes. IT experts can also quickly locate the cause of the problem.
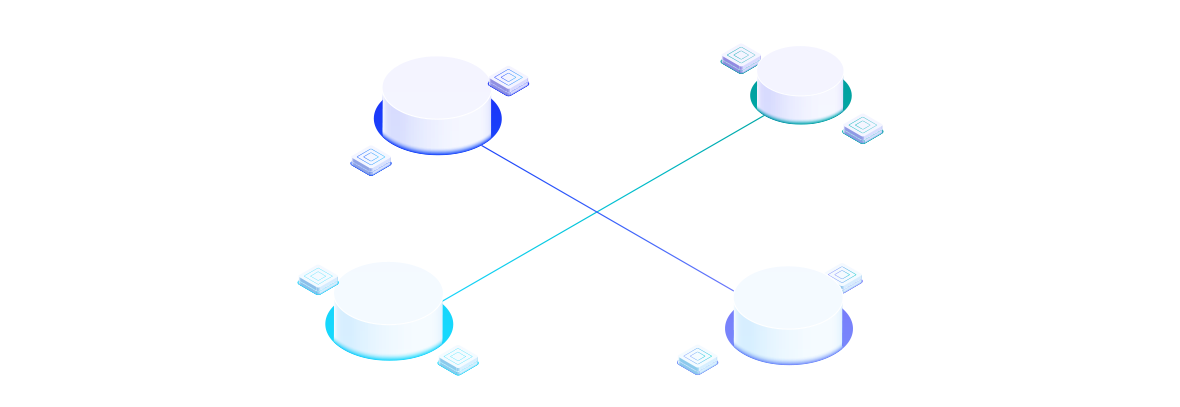
From the user terminal, to the network, to the server, locate performance bottlenecks

Five dimensions of Grand Festival services

Application system quality acceptance solution

The software acceptance program covers the entire software life cycle. The continuous optimization and improvement of the software includes acceptance testing, defect discovery, tuning, delivery and release, and operation and maintenance.

Quality acceptance program value

A single test iteration time is greatly reduced

Complete a round of pressure test in a few hours, and the time of a single pressure test is reduced by 70%

Reduced mean time to repair

Through infinitely close to the real performance test, application stinging and related problem exposure, it reduces the probability of problems for operation and maintenance.

Provide accurate basis for system expansion

Verify the maximum number of users that the system can support, and reasonably expand the hardware resources more accurately and quantitatively.

Discrete sub-regional user behavior verification

Accurate optimization of user network, CND, load and other environments

Create complex scenarios for stress testing
Through the distributed pressure load machine, the user behavior characteristics or client behavior characteristics of the business system can be simulated, and up to millions of virtual users can be generated on demand. During the performance test, the service status of the tested system is monitored in real time, and the performance of the tested system is dynamically located Bottlenecks help users quickly solve performance problems.

# Full interface visualization operation
# Test script automated recording generation
# Scenario test duration can be flexibly increased or decreased as needed
# Quantitative data is quickly analyzed and presented in seconds
Powerful tracking and diagnosis functions
The Grand Festival solution can track and diagnose faults in the network, basic components, and application code, and clearly understand the location of the problem, so that the problem can be solved more quickly and operating costs can be reduced.

# Network fault domain location
# Basic resource usage monitoring
# Application code and SQL statement positioning analysis

G.F. Partner Program

Work with G.F. to create a win-win future
Cooperation concept

G.F. is committed to building a cooperative and win-win channel ecosystem, Welcome like-minded partners to join Grand Festival, Open up a new world of intelligent operation and maintenance.

Partner system composition

Ordinary partner

Gold partner

Platinum partners

OEM partners

Partner support

img

Strong brand

10 years of technology and product accumulation, hundreds of thousands of developers and users around the world, 50,000 enterprise-level users, ISO9001, CMMI3 global system certification, AIOps field leader

img

Rich product line

G.F. provides intelligent operations including AIOps Maintenance, end-to-end application performance perception, IT events and Four product lines for service management and stress testing

img

Professional channel support

Provide different types and levels of partners Incentive policies, organize partner salons and various Marketing campaign

img

Perfect platform interface

Strong business development and docking capabilities, enriching Product API interface

img

Marketing Development Fund

Increase investment in partner marketing activities, the fund can For advertising, website construction, activities, presentations And direct marketing activities

img

Special after-sales service support

Provide professional standardized product support services and Regular product iterative upgrade service, customized development Services to ensure the delivery and use of products

About G.F.

Grand Festival International is an IT operation and maintenance management software and service provider. Founded in World in 2008, the company has always been adhering to the corporate mission of "making operation and maintenance smarter", and is committed to providing integrated intelligent operation and maintenance solutions for enterprise-level users in World. Grand Festival has Ai server performance monitoring, Bi browser performance monitoring, Ni network application performance monitoring platform, M mobile performance monitoring, Si IT basic resource operation and maintenance platform, ITSM fully automatic IT service management platform, Li intelligent business log analysis platform , Support two deployment methods, SaaS and privatization.